Selected Past Projects

I. Telescope Control Systems

Interferometric On-the-Fly (OTF) Mapping with the SMA (2024 – 2025)

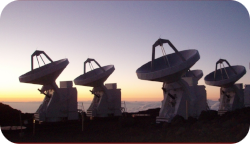
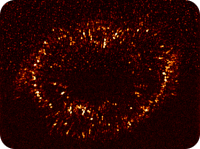
in 2025, the Submillimeter Array (SMA) became the first mm-wave interferometer for offer an On-the-Fly (OTF) mapping mode.
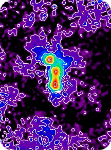
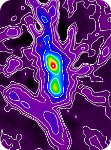
4'x4' OTF demonstration
Figure 1. 4′×4′ OTF demonstration map.
Interferometers, like the Submillimeter Array (SMA) in Hawaii, are excellent at providing images with high resolution. However, they can do that only over a small area of the sky at once. To cover larger areas, we combined multiple individual pointings, known as a mosaic map. The issue with mosaics is that they are very inefficient. A lot of the time is spent waiting before data can be collected at each position. On-the-fly mapping is a much more efficient alternative. In this case, all antennas scan synchronously across a mapped area, continuously delivering data. The challenge is to ensure full synchronicity; accurate position labeling of the archived data; real-time processing of the large data volume; and processing it for the full image. I am responsible for most of the first three.

MIT Haystack 37-m Telescope Control System (2022)
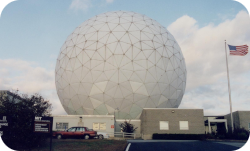
radome picture
Figure 2. The radome of the Haystack 37-m telescope.
MIT's 37-m Haystack observatory is one of the largest centimeter and millimeter wavelength facilities in the world. It is operated jointly by MIT and Lincoln Labs. In recent times it was used exclusively as a radar station. But now it is also being recommissioned for shared use as an astronomical telescope. In 2022, I was given the chance to design and implement a brand new telescope control system (TCS) that allows control of the telescope for astronomical observations, including support for scanning (on-the-fly and Lissajous) around targets with the available receivers. My solution was to build and deliver the core of a new ecosystem, in which the telescope can be remote controlled via ONC RPC (from C, the command-line, and via a Python library). The telescope can also be monitored via a hierarchical and rich (as in including metadata) database built around a Redis server. The new control system is now being used regularly to conduct EHT VLBI observations for imaging the event horizons of supermassive black holes.

II. Submillimeter Technologies

BICEP3 / Keck — μMUX Readout Interface (2017 – 2019)
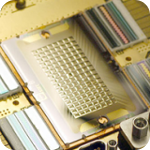
Picture of a GPU chip.
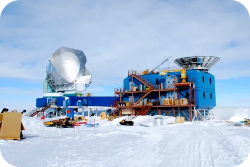
Figure 3. SPT and BICEP3 buildings at the South Pole
BICEP3 / Keck is a ground-breaking Cosmic Microwave Background (CMB) polarization experiment, at the South Pole Station on Antarctica. The goal of the experiment is to detect the so-called B-modes, which carry the signatures from the earliest moment of the Universe after the Big Bang, providing insight into a regime of physics beyond our reach today. I played a very small part in this experiment by helping interface Stanford's microwave SQUID multiplexing (muMUX) readout technology to the existing data acquisition system for one of the telescopes; installing and interfacing a new RF signal scanner, and providing other support during my brief stay at the South Pole.

GPU-based Detector Readout (2012 – 2017)

To realize future far-infrared (FIR) instruments with 100 thousand or a million detectors, we must increase the multiplexing of the readouts. At minimum, a few thousand detectors need to share a single readout line, for a total cost (production + readout) of $1/pixel or less, in order to provide a feasible path to larger detector arrays.
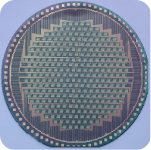
Picture of a GPU chip.
Figure 4. An example GPU chip. Not the actual chip we use...
Kinetic inductance detectors (KIDs) promise to provide high multiplexing ratios (~1000 channels per line) at low cost for (sub)millimeter and far-infrared detectors. The detectors are resonators in the 100 MHz to a few GHz range. Radiation, incident on the detectors shifts their resonant frequencies slightly. Our approach was to use the vast parallel processing power available at low cost on today's GPUs, to retrieve the frequency shift of ~1000 detectors at 100—200 MHz simultaneously, in real time, with an accuracy of ~40 mHz √s. A prototype of this readout has been demonstrated in 2015 at the Caltech Submillimeter Observatory (CSO) with the MAKO-2 instrument.

SuperSpec (2012 – 2017)

SuperSpec schematic
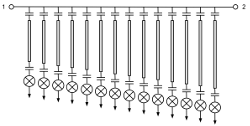
Figure 5. Transmission-line filterbank schematic of SuperSpec.
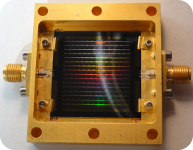
In 2011, I and Jonas Zmuidzinas came up with the idea of realizing moderate resolution (R~100–1000) spectrometers on-chip, using a lithographic waveguide filterbank to channelize radiation into power detectors, such as kinetic inductance detectors (KIDs). The lithographic filterbank approach allows for a 100-fold shrinking along at least two dimensions (~100,000-fold in volume), compared to optical alternatives (such as gratings, Fabry-Perots, or VIPAs), and provides a pathway to a future with intergal field unit (IFU) spectroscopic focal plane arrays. I provided the initial circuit simulations (using SuperMix), that demonstrated the concept, provided useful design insights, and guided the practical approach taken by (SuperSpec). SuperSpec is expected to become operational at the Large Millimeter Telescope (LMT) in Mexico.

CRUSH (2002 – 2017)

One of the challenges for the next generation of large-format far-infrared cameras relates to how we analyze/reduce the resulting volume of data (100 GB to 10 TB per hour) in real-time, or preferably an order of magnitude faster.

CRUSH logo
Figure 6. CRUSH is the most widely used data reduction package for ground-based submillimeter imaging arrays.
CRUSH is a leading data reduction software for the best (sub)millimeter and far-infrared cameras around the world. It began as part of my PhD project in 2002, but today its innovative algorithms are used almost universally in the field, including other packages like SMURF (JCMT) and BoA (APEX). CRUSH maintains its edge in the development of new algorithms; in its unsurpassed data reduction quality; speed; and versatility alike. CRUSH also provided the official scan-mode imaging reduction pipeline of the HAWC+ infrared camera on board the NASA / SOFIA telescope.

SIS Mixer Design (2002 – 2004)

Layout masks
Figure 7. Layout masks of the new CSO mixer chips, with twin 12 kA/cm2 AlN junctions.
J. Kooi and I set out to replace the aging CSO facility receivers in all four bands (180–280, 280–420, 380–540, and 580–730 GHz) with new state-of-the-art technology. The new receivers were designed to be ultra wide band (up to 50% fractional RF bandwidth), tunerless, with 4 GHz IF (the mixers I designed supported 12 GHz flat IF bandwidth in 2002), and provide unprecedented stability. We opted for a balanced configuration, instead of side-band separation, to suppress LO noise – a choice, which was vindicated by the exceptional noise performance (i.e. sensitivity) of the new receivers when they were finally installed on the CSO in 2014.

The wide-band operation (up to 160 GHz) posed challenges for the mixer design with the medium current-density (12 kA/cm2) AlN barrier junctions supplied by JPL Microdevices Lab at the time. I used SuperMix simulations to determine the most robust design capable supporting that bandwidth, resulting in a minimalistic matching network in combination with twin SIS parallel junctions. The mixers operate near or slightly above unity gain in all bands (180 – 730 GHz). I suggested a similar design for HIFI Band 1 as a consultant to LERMA.

III. Instrumentation

SOFIA / HIRMES (2017 – 2019)
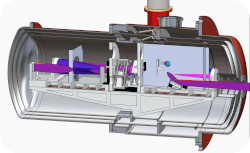
CAD drawing of HIRMES
Figure 8. Schematic of the HIRMES instrument.
HIRMES was to be a 3rd-generation instrument to fly on-board of NASA's SOFIA airplane telescope, until it was cancelled in 2019. It would have provided simultaneous imaging and medium- to high-resolution spectroscopic capabilities. My role in the project was to provide the data reduction pipeline for this instrument (whose prototype I delivered and tested with simulated data before the cancellation). It was an exciting challenge as it required the development of a new 3D imaging mode (2 spatial dimensions + 1 spectroscopic dimension) for CRUSH. The data reduction software was pretty much complete by the time the project was cancelled. The instrument concept then morphed into the POEMM balloon mission.

SOFIA / HAWC+ (2012 – 2017)

SOFIA in flight
Figure 9. The SOFIA airborne observatory.
HAWC+ is a far-infrared camera operating at wavelengths between 53 and 216 microns, for stratospheric observations on-board of NASA's SOFIA airborne observatory. It was used to study star-forming dust clouds in our galaxy, and probe magnetic fields in star-forming environments. My principal responsibility was to provide its imaging and scan-mode polarimetry pipelines (CRUSH), and contribute to the overall data reduction development and instrument characterization. Our next flights are scheduled for the beginning of October. Stay tuned for updates...

My role in this project is to provide the imaging data reduction facility (CRUSH, see above), the in-flight real-time instrument diagnostics, and the data analysis for detector testing and development. It is also possible that CRUSH will eventually enable a rotating waveplate, scan-mode polarimetry – like G. Siringo and I have demonstrated for PolKa on APEX – although probably not before commissioning of the instrument.

MAKO / MAKO-2 (2012 – 2015)
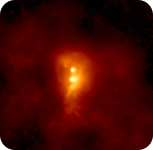
Sgr B2 with MAKO MAKO array
Figure 10. left: MAKO focal-plane array (Chris McKenney). right: Sgr B2 imaged at 350 μm with MAKO, and reduced by CRUSH.
MAKO was a detector & multiplexing technology demonstration camera built for the CSO, operating at 350 μm and 850 μm wavelengths, a project led by C. D. Dowell at Caltech. It's main purpose was to demonstrate the technologies needed for the large, 100-kilopixel or megapixel, cameras for the future. Specifically, it is to demonstrate low-cost production, with high-multiplexing and low readout cost, in order to meet the ultimate goal of $1/pixel combined expense.

My role in the project was twofold: providing a readout solution ( see above) for its detectors, and its data reduction facility, CRUSH (see above). MAKO had its first successful run in April 2013, with newer generation detectors tested in May 2015, and produced some beautiful images with the help of CRUSH.

GISMO (2009 – 2015)
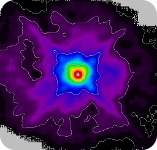
Beam map on Mars GISMO focal plane
Figure 11. The 8×16 TES array of GISMO (left). The IRAM telescope beam at 2 mm imaged by GISMO and reduced by CRUSH – 8'x8' size, 50+ dB dynamic range, logarithmic scale (right).
GISMO is a 2-mm camera built by J. Staguhn and his team at NASA Goddard Space Flight Center (GSFC) for the IRAM 30-m telescope near Granada, Spain. Its 128 pixels fill about half the telescope's ~4' field of view. GISMO has been operational between 2008 and 2015. My role was in improving the instrument's sensitibity, from ~70 mJy s0.5 initially to around 8 mJy s0.5 by 2012 (with improved grounding, bias optimization, and optical troubleshooting, and tweaking operating procedures).

APEX Cameras (2006 – 2012)

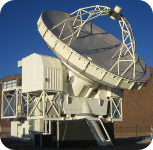
LABOCA focal plane The APEX telescope
Figure 12. APEX (left), and LABOCA's 295-pixel focal plane (right).
During my time at the Max Planck Institute (MPIfR) I worked on the APEX bolometer cameras, especially LABOCA (850 μm) and SABOCA (350 μm). I have contributed to troubleshooting and optimizing its electronics (AC bias level and frequency), its signal chain (bias locked sampling, anti-alias filtering and downsampling, and microphonic avoidance), and optics (spillover and bandpass). I also wrote APEX Bridge software, a configurable anti-alias filtering and downsampling unit, which was inserted between the control system (APECS/FitsWriter) and any telescope backend, in a transparent manner. I also modified CRUSH, and created miniCRUSH, and then CRUSH-2 to support the APEX cameras, which was widely used by ESO.

PolKa (2009 – 2011)

OMC-1 polarized light OMC-1 unpolarized light
Figure 13. Unpolarized (left) and polarized (right) 850 μm emission in OMC-1, imaged with PolKa/LABOCA, reduced by CRUSH.
PolKa (Siringo et al. 2012) is a polarimetry frontend for imaging cameras, conceived and built by G. Siringo. Its unique feature is the room-temperature reflective half-wave plate (a wire grid at λ/4 spacing in front of a flat mirror), which makes it a seamless addition to any instrument.

Giorgio and I have beaten the odds to demonstrate its operation, by successfully separating the polarized emission of OMC-1 from the unpolarized part, despite bad weather and many technical problems. I have innovated a new polarimetry data reduction approach for fast scanning with a rotating waveplate (i.e. the telescope moves by more than a beam during a polarization cycle). Polka data has been piblished by Wiesemeyer et al. (2014).

SHARC-2 (1997 – 2003)
SHARC-2 focal plane
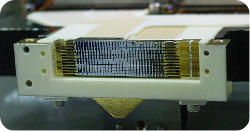
Figure 14. The 32×12 focal plane array of SHARC-2 (Dowell et al. 2003).
SHARC-2 was a 384-pixel 350 μm camera built by C. D. Dowell for the CSO. Not only was it the largest bolometer camera of its time (and for a long time to come), it also was a game changer in the way we operate submillimeter arrays. I proposed total-power observing (instead of position-switched differencing), and thus SHARC-2 was a pioneer of what later became the standard mode of operation for most submillimeter cameras. To enable total-power operation, I designed its readout concept (delayed demodulation of the AC-biased detectors, filtering, DC-subtraction), developed new observing modes (such as Lissajous scans), and pioneered a new data-reduction approach (CRUSH) to handle total-power bolometer timestreams.

I also wrote SHARC-2's first control and data acquisition software (JSharc). After commissioning in November 2002, I developed a direct calibration-scheme for the non-linear loading-dependent bolometer response, line-of-sight measurement (direct tau), a server for providing daily atmpspheric opacity fits (MaiTau), and a characterization of the 350um atmosphere (sky noise spectrum and effective NEFD statistics).

IV. Astrophysical Science

S-Z Clusters (2013 – 2015)
PLCK G147.3 from Mroczkowski et al. (2015)
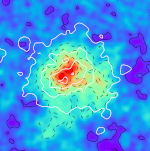
Figure 15. An S-Z Cluster observed with GISMO, reduced by CRUSH.
I became interested in Sunyaev-Zel'dovich (SZ) clusters, partly because of GISMO. The SZ effect is the upscattering of cold Cosmic Microwave Background (CMB) photons as the radiation passes through the hot ionized material of intergalactic gas. It results in a partial depletion of photons at millimeter wavelengths, which is most pronounced around 2 mm (GISMO's band), producing the unique negative signature in maps.

The IRAM 30-m telescope has a niche for clusters. Most other SZ studies are performed either on small (10-m class or smaller) telescopes, or else dedicated interferometers that have short (~10-m baselines) to retain sensitivity on the arcminute scales of most clusters. The 30-m telescope offers more collecting area than the smaller dishes or the SZ interferometers, and a resolution in-between those. It is a sweet spot, offering both excellent sensitivity and sufficient resolution for cluster sub-structure, and/or to resolve dusty galaxies (e.g. bright cluster-core galaxies) embedded within. We published the first resolved SZ cluster at 2-mm wavelength in Mroczkowski et al. (2015).

Dust SED Models (2009 – 2010)
SED plots
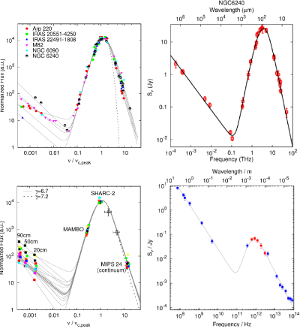
Figure 16. My multi-temperature SED model describes a range of extragalactic objects: local starburst galaxies (top row), z~2 bumpies (bottom-left), and quasars (bottom-right).
Our understanding of the physical characteristics of star-formation and dust heating is only as good as the models we use to interpret the observations. While the thermal radiation emanating from galaxies is essentially greybody-like, it cannot be sufficiently modeled as a single temperature radiation. And, templates derived from radiative transfer modeling are not necessarily representative either.

My spectral energy distribution (SED) model assumes an underlying powerlaw distribution of temperature components (dM/dT ~ T) contributing to the aggregated emission of a galaxy. Power-laws are common (e.g. the initial mass function, brightness distribution of sources etc.), and can arise both on the macro and micro scales. We do not have to know the exact origin of the observed power law in order to characterize it – it could be a property of individual clouds, or it could arise from the distribution of many clouds with different underlying properties. The only thing that matters is whether it accurately describes what we see or not (it does). The model also have has few free parameters (just the powerlaw index γ in excess of an equivalent single-temperature model), allowing robust fitting of physical properties (Md, T, β, γ, emission size), and calculating luminosities analytically.

Properties of SMGs (2003 – 2010)

SMG multiplet
Figure 17. An SMG triplet. Its three components are unresolved by most submillimeter surveys.
Submillimeter-selected galaxies (SMGs) yield an unbiased characterization and history of star-formation in the Universe – provided we can learn enough about them. Whereas detecting them (typically near 1 mm wavelength) is relatively easy, seeing them in other bands is not, and measuring their distances is extremely challenging.

Based on the first limited redshift survey of SMGs (Chapman et al. 2005), I conducted a 350 μm follow-up, with SHARC-2 (Kovács et al. 2006). The addition of a shorter wavelength datum, near the SED peak, enabled the first true far-infrared (FIR) characterization (dust temperatures, masses and luminosities) of the SMG population. I concluded that SMGs were dusty galaxies typically around 35 K (although possibly getting hotter at higher redshifts), and that they strongly abide by the radio-FIR correlation (Helou et al. 1988) of local star-forming galaxies. As such, the SMG luminosities are predominantly fueled by star-formation, with no significant heating by an AGN, even when these are co-present.

In collaboration with A. Omont, we showed (Kovács et al. 2010) that the z~2 starburst galaxies selected by Spitzer (bumpies with a strong 24 μm excess due to the 7.7 μm PAH feature redshifting into that band) were essentially also SMGs, with nearly identical properties to the original Chapman et al. 2005 sample. Our study also provided one of the first hints that some of the mm-bright sources were in fact multiplets (we caught a triplet!), and that SMGs may be strongly clustered on short angular scales.

The LABOCA Deep Field (LESS) (2007 – 2010)
The CDFS with LABOCA
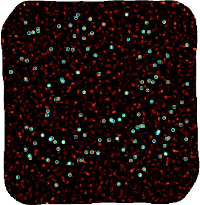
Figure 18. The E-CDFS by LABOCA with sources circled (CRUSH reduction).
Axel Weiss and I co-headed the deep 850 μm mapping of a half-degree by half-degree patch of the Extended CHANDRA Deep Field South (ECDFS) with LABOCA, a joint project between the Max Planck Institutes and ESO consuming over 300 hours of net observing time. The result was the deepest (around 1.2 mJy/beam rms over the full 1/4 sqdeg field), cleanest (purely Gaussian noise!), and most complete census of submillimeter galaxies selected at 850 μm, yielding some 120 SMGs.

Apart from contributing to designing and conducting the survey, I was most active in pushing the data reduction to the limit, and was responsible for source extraction, the P(D) number counts analysis, and the deboosting of fluxes – all areas in which I have pioneered new approaches.

One of the major conclusions of the survey was that we saw no evidence for a break in the powerlaw, describing the number of SMGs vs their brightness, despite the larger range of sensitivity we had vs prior surveys. We suspected that such breaks were a by-product of the circular, catalog-based number counts approach used by some of the preceding surveys (which we confirmed explicitly via simulations). A second major conclusion was that our number count models accounted for most (80–100%) of the FIR background at 850 μm as measured by COBE. Thus, we have indirectly proved that the mm-wave background is composed (almost) entirely of SMGs.

The LABOCA Survey of Nearby Galaxies (2007 – 2008)
Cen A composite NGC 253
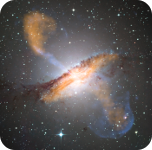
Figure 19. Nearby galaxies with LABOCA: NGC 253 (left) and a composite image of Centaurus A (right), with the LABOCA image shown in orange hue.
Axel Weiss and I jointly led the program to map some nearby galaxies at 870 μm with LABOCA. Local galaxies are faint at 850 μm and are also quite extended, which is why sensitive 850 μm measurements (or at longer wavelengths) were not available before, even though they were much needed to constrain the massive amount of cold dust in these galaxies.

Deep observations of a handful of galaxies confirmed the value of the mm-wave measurement in determining the amount of cold star-forming material in these objects (Weiss et al. 2008). It also proved that single-temperature models, quite common until then, were inadequate for characterizing galaxies as a whole. This, in turn inspired me to develop my empirical multi-temperature SED model for describing the thermal emission of galaxies, one of my research areas today.

Millimeter-wave Spectroscopy of Carbon-chain Radicals (1996 – 1997)
H2C5 and H2C6
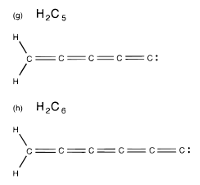
Figure 20. The cumulene carbenes H2C5 and H2C6 detected with the FTS.
The millimeter-wave spectroscopy lab of Pat Thaddeus used rotational spectroscopy to identify the exotic species of molecules that populate the interstellar medium (ISM). I ran some of the experiements. Using the 'old' glow-discharge absorption spectrometer, I detected C8H, C7H, and HC13N (in that order), leading to several papers (McCarthy et al. 1996, Travers et al. 1996a, b; McCarthy et al. 1997a). The detection of C7H marked a turning point in laboratory spectroscopy: it was the first time that lab spectroscopy preceded astronomical detection (Guelin et al. 1997), which then became the new norm.

Later, I was charged with getting the new Fourier Transform Spectrometer (FTS) to work. I wrote a large part of its control and acquisition software, and proceeded with optimizing the operational parameters for detection. My efforts were rewarded by getting its first detections: the cumulene carbenes H2C5 and H2C6 (McCarthy et al. 1997b), the latter of which was subsequently detected in space also (Langer et al. 1997).